Lane Bracketing: How to Implement ISTA’s PCG-03 Recommendations
On July 22nd, 2022, ISTA released PCG-03: Performance Qualification (PQ) and Performance Verification (PV)...
read Details

On July 22nd, 2022, ISTA released PCG-03: Performance Qualification (PQ) and Performance Verification (PV) Best Practice Guideline. PCG-03 takes the first steps toward standardizing best practices for PQ strategy and execution for the biopharmaceutical industry, as it is the first document to compile strategies from thought leaders in the industry and provide a path forward for transport validation work.
We applaud ISTA for this useful and comprehensive list of considerations for determining your PQ strategy. However, there remains a clear gap on how to manage and implement their recommendations. The items listed within the document require further context to enable the industry to form a cohesive approach to PQ strategy.
This article series will seek to dive deep into the considerations listed by ISTA and discuss the implications and risks of each topic. Each article will contain a recommended tactical approach to each of these considerations:
As each article is released, we will link it in the Table of Contents above so you can navigate to each topic. In this article, the experts at Modality Solutions are diving into the Monitoring recommendations in PCG-03.
The previous installments in this article series should have you understanding when to execute your PQs, which lane(s) to perform your verification studies, and how to juggle multiple shipping options. Now begins the work on the finer details of PQ studies. This post will focus on temperature monitoring strategies for PQ shipments.
The primary goal of any shipping PQ study is to demonstrate that the temperatures determined by your stability studies and drug formulation testing are maintained during shipping. Therefore, your monitoring strategy requires collecting appropriate temperature data from suitable locations within a shipper. Important factors for your monitoring strategy include the number of monitors, their location, and working with start-up delays.
Additionally, we will cover one additional monitoring tip that can make or break a root cause failure analysis if nonconforming data is recorded.
Before we dive in, a quick note on applicability: a PQ study is a defined number of shipments that undergo enhanced documented scrutiny to demonstrate that the process is working as expected. Therefore, there is no regulatory agency expectation for temperature monitoring during standard shipments to match your monitoring during PQ studies.
Before even looking at temperature monitor placement, you must ensure that you have appropriate monitors for your PQ study. All monitors have a specified temperature range in which they are qualified; monitors that are qualified for refrigerated shipments may not be qualified for frozen shipments, for example. Secondly, all monitors must be calibrated for the results of your PQ to be valid.
There is no prescribed number of temperature monitors required for a PQ study. Larger units, such as pallet shippers, should have two monitors for a PQ to account for temperature variation across the payload space. Smaller units can use a single temperature monitor, although you may opt to use two monitors for shipments assessed to be higher risk.
The placement of monitors should follow the identified locations of hot and cold extremes during the Operational Qualification or OQ. Most thermal packaging is ‘off-the-shelf,’ qualified by the vendor, and can be available for your review. The OQ should be designed to expose the packaging unit to extremes of the operating conditions and monitor temperatures across the payload space, effectively mapping the temperatures within the thermal shipper. This mapping determines the locations of extreme temperatures and, therefore, the placement of temperature monitors.
Note: We will not discuss the best practices of Operational Qualifications in this series. There are excellent resources for thermal packaging OQs, such as ISTA Standard 20, ISTA PCG-02, and PDA Technical Reports 64 and 72.
For single-bounded temperature requirements with no lower limit, the monitors should be placed at the location(s) of the highest temperatures. For double-bounded requirements (upper and lower limits), you will need to investigate the OQ to determine the warmest location during summer testing and the coldest location during winter testing. These extremes may even occur in the same location within the shipper.
There are instances, however, where you may not need to focus on the extremes or may be unable to. If the OQ reveals that temperatures within the shipper are relatively uniform, such as extremes within 1 °C, then there is no need to focus on a single location. The temperature monitor(s) can be placed anywhere within the payload with confidence that the recorded temperature is representative of the overall product temperature.
Secondly, there may be a scenario where extremes may occur in areas where the product will not be located. A frequently occurring example of this is in a large active thermal shipper. The warm and cold extremes will often occur towards the top of the unit. However, you may be shipping only a few cartons of material and hardly filling half the available height of the shipper. In this case, temperatures recorded at the top will not represent product temperatures, so the specific location does not need to be monitored. Monitor(s) should instead be placed on the top of your product load to establish a recording location nearest to the warm spot. Generally, internal temperature monitors used during PQs should be attached directly to the product to ensure recorded temperatures represent what the product is experiencing during transport. “Air” temperature monitors may be used for informational purposes but do not need to be part of the acceptance criteria for the study.
In addition to understanding where to put the monitors, the configuration can also be important. The two standard customizable choices for temperature monitors are alarm set points and start-up delay.
The acceptance criteria for the study should not be tied to the alarm-state of the monitor. The alarm functionality can be used as extra information, but determining acceptance criteria requires assessing the recorded data file. That being said, it is still essential to understand the alarm settings.
The alarm setpoint should be based on the temperature requirement for the shipped product, including significant figures. That means a product requiring 2 – 8 °C has an allowable range of 1.5 – 8.4 °C. This extra half a degree of allowable exposure is often overlooked.
The second function, start-up delay, can impact the acceptability of the study if not programmed correctly. Typically, the acceptance criteria are written to allow a specified duration for the equilibration of temperatures. This equilibration time accounts for initial temperature data not reflecting product temperatures due to a non-preconditioned monitor or air inside the packaging needing to be cooled. Suppose the start-up delay is longer than the specified equilibration period. In that case, you will be unable to demonstrate that the product did not experience an excursion before the monitor started recording.
We recommend programming with no start-up delay. This approach has a few advantages. First, this requires you to treat the start of the equilibration period as when the packing process was completed rather than when the monitor was started. Anyone working in cold chain shipping has experienced temperature monitors in alarm because the monitor started well before the shipper was ready to be packed. The second advantage comes if investigating an excursion.
Having temperature data from the start of the packout can be extremely useful in completing a root cause failure analysis. For example, the temperatures recorded at the beginning of the packout can reveal if the preconditioning of gel packs or the product was not adequately performed.
One additional monitoring tactic that can greatly ease investigations of nonconforming data is the inclusion of an ambient temperature monitor. Including a single temperature monitor outside the shipper reveals a wealth of information on the conditions during the shipment that may have caused a failure.
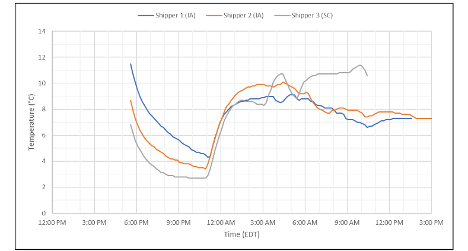
Take, for example, the data in the below graph. The graph below is actual temperature data from samples shipments that Modality Solutions conducted. Three shippers on the same route all had similar temperature profiles, including a severe spike above 8 °C, causing a failure of the study.
What could have caused this?

There are many ways to consider this failure:
All of these could be possible if this is your only data. In that case, how do you proceed? Was the failure due to thermal properties, physical properties, or handling? A combination of these factors?
Luckily, an ambient monitor was included with these shipments. The ambient monitor showed temperatures reached a maximum of 45 °C (113 °F) during this period. We were able to track the location of the spike to a specific facility and work with the handler to ensure that the cause of these extremes would be corrected. Additional shipments were conducted to demonstrate that the error was due to handling and that no further modifications would be required for the shipper. Without the ambient data, unnecessary steps may have been taken to alter the thermal shipper or shipping network.
This installment focused on the monitors used to collect the data. Gathering the correct data, however, is only the first step. The next step is how to analyze the data collected during a PQ to make a final determination on the state of the shipping process. The subsequent installment will focus on acceptance criteria for PQs, including non-temperature data. Catch up on the first three articles in the series below:
Modality Solutions is a leading provider of innovative and comprehensive solutions for the biopharmaceutical industry. Our team of experts has extensive experience in the industry and works closely with national and international regulators to ensure that our clients stay ahead of the latest industry developments and best practices. We pride ourselves in providing tailored solutions to meet the unique needs of our clients, and we are committed to helping organizations achieve their PQ goals. Follow us on LinkedIn to stay updated on our latest developments.
On July 22nd, 2022, ISTA released PCG-03: Performance Qualification (PQ) and Performance Verification (PV)...
read Details
On July 22nd, 2022, ISTA released PCG-03: Performance Qualification (PQ) and Performance Verification (PV)...
read Details
On July 22nd, 2022, ISTA released PCG-03: Performance Qualification (PQ) and Performance Verification (PV)...
read Details